
Key takeaways
Micron Technology (MU) just reported the most extreme quarter in its history — $41.46 billion in revenue (+346% year over year) and a record 84.6% gross margin — and then guided the next quarter even higher. After an ~18% post-earnings jump to roughly $1,238 a share (a ~$1.41 trillion market cap), the real question is no longer whether the AI-memory boom is real, but whether today's ~$100-per-share earnings power is a cyclical peak or a contractually-defended new baseline. This is a primary-source breakdown built from Micron's SEC filings (the 10-Q and 8-K filed June 24–25, 2026) and the Teahose expert corpus — where Micron and the memory shortage appear in 14 of the 1,150+ expert investor conversations we've analyzed (as of June 2026), including direct commentary from Gavin Baker of Atreides and Aravind Srinivas of Perplexity.
The one-sentence answer: Micron is no longer "just" a commodity-memory cyclical — the AI build-out has made memory the binding bottleneck in compute, and Micron has, for the first time in the industry's history, locked a hard price floor under a quarter of its book; but after the stock gapped ~+18% on the print to ~$1,238 (a ~$1.41T cap), it already prices in much of that good news, so the fundamental bull case is far stronger than the risk/reward at today's entry.
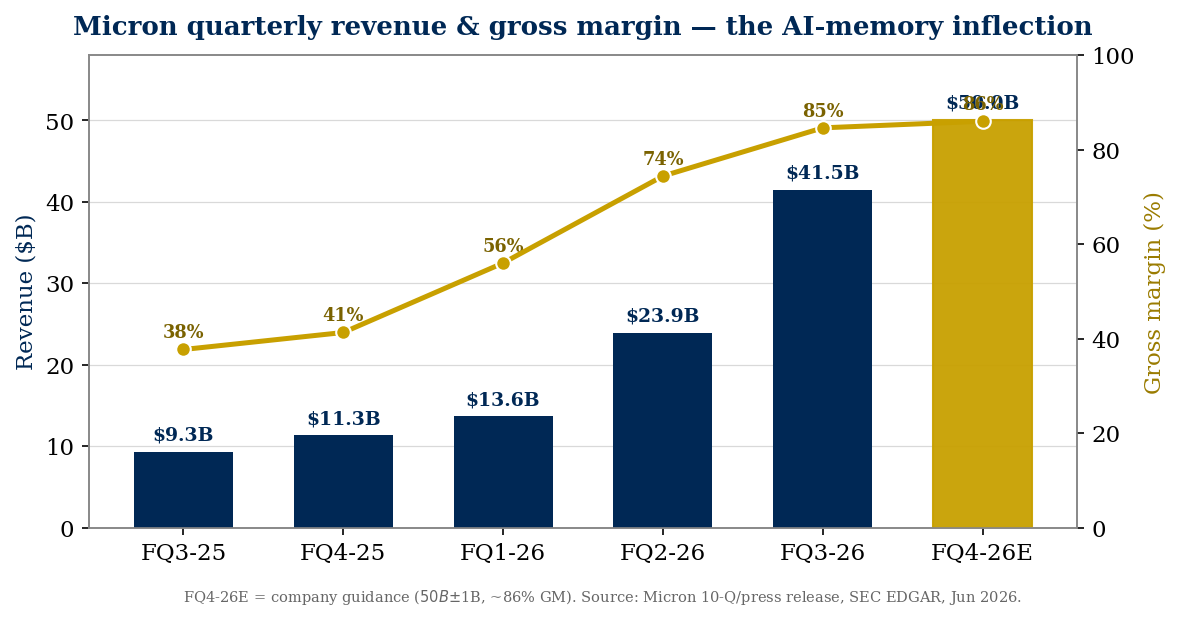
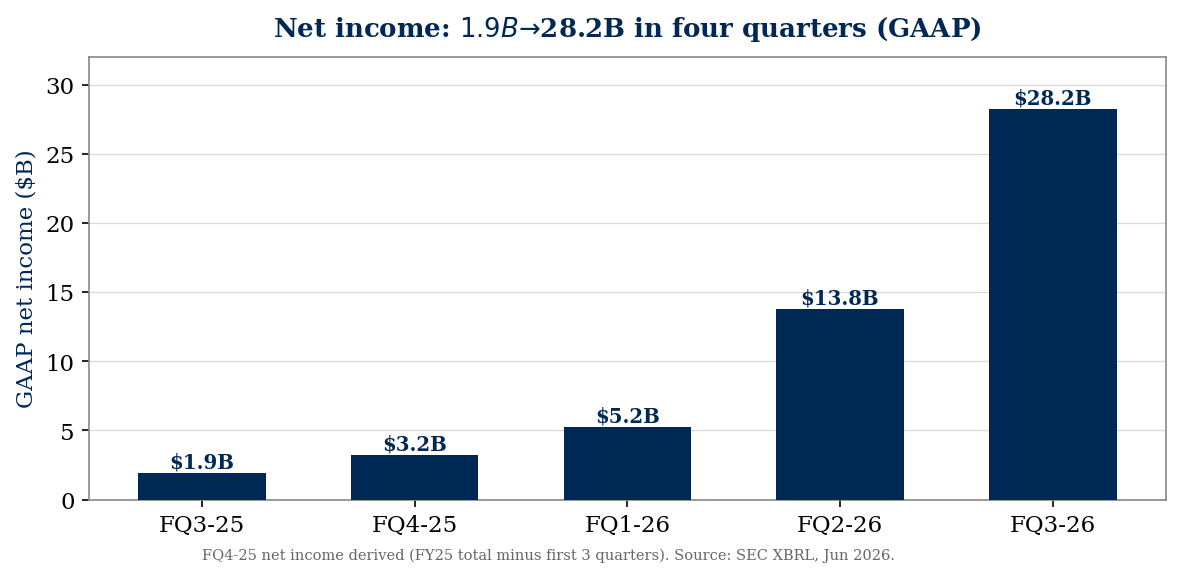
What just happened (all from the SEC filing, not estimates): In the quarter ended May 28, 2026, Micron did $41.46B of revenue (+346% YoY), an 84.6% gross margin (a company record), and $24.67 GAAP EPS — then guided Q4 up to $50B revenue and $30.73 EPS at ~86% margin. Net income went from $1.9B to $28.2B in four quarters. This is the most violent up-cycle in the company's history.
Why it's happening (the bull thesis — and it holds up):
- Memory is the bottleneck. Modern inference (reasoning + long-running agents) is memory-bandwidth-bound; every AI accelerator carries a large, growing HBM payload. "Whatever is the bottleneck commands the price."
- Only three providers (Samsung, SK Hynix, Micron ≈ 90% of DRAM revenue), now exercising capital discipline.
- No new fabs until ~2028 (first new greenfield wafers = Micron's Idaho fab in 2H2027; Samsung P5 late 2028) — so 2026–2027 supply is essentially fixed.
- HBM cannibalizes commodity supply — HBM eats ~3× the wafers per bit, so the AI ramp starves ordinary DRAM and lifts the entire portfolio (that's why blended margin hit 84.6%, not just HBM).
- The Strategic Customer Agreements (SCAs) — 16 non-cancelable, take-or-pay deals = ~$100B minimum contracted revenue, backed by $22B+ upfront ($18B cash), 5-year terms through 2030, with an explicit price collar (floor AND ceiling).
The valuation paradox: even after the +18% gap, MU screens expensive on trailing earnings (~28× TTM GAAP) and only modestly-priced on run-rate (~10× the Q4-guide annualized run-rate, ~12.7× forward consensus). A low-teens forward multiple still means the market is pricing an earnings decline — it implies a "normalized" EPS of only ~$69–83 vs. a ~$123 run-rate. The entire debate reduces to one question: is ~$100/yr EPS a cyclical peak or a contractually-defended baseline?
The honest verdict: The thesis is real and the SCAs genuinely raise the trough (a repeat of FY2023's −18% gross margin and $5.8B loss is now much less likely). But the SCAs floor only ~25% of the book; ~75% of bits still re-price to spot, the floors are untested, and Micron's own record capex seeds the next correction in 2027–2028. At ~$1,238, probability-weighted return is clearly negative (~−10% to −13%) with a fat left tail. Conclusion: a world-class way to own the AI-memory super-cycle — but the easy money was made at the ~$1,049 pre-print level; chasing the +18% gap pays a fair-to-full price for a cyclical at the top of its best-ever cycle, and sizing must respect that this is still the most cyclical industry in tech.
| Scorecard | Read |
|---|---|
| Q3 FY26 results | ★★★★★ Historic — rev +346%, 84.6% GM, $24.67 EPS |
| Balance sheet | ★★★★★ Fortress — +$24.4B net cash, lean inventory |
| Structural thesis (bottleneck) | ★★★★☆ Verified — 3 players, fabs to 2028, HBM cannibalization |
| SCAs / cycle-break | ★★★★☆ Genuine but partial — floors ~25% of book, untested |
| Valuation / entry | ★★☆☆☆ Much already priced; risk/reward balanced-to-negative |
| Cyclicality risk | ★★☆☆☆ The defining risk — peaks historically last 2–4 quarters |
1. The Governing Thesis
Everything below ladders up to a single proposition and its single counter:
The proposition (bull): AI has converted memory from a boom-bust commodity into the scarcest input in the most important industry on earth. Demand (tokens) is compounding while supply (wafers) is fixed until 2028, and Micron has now contractually floored a growing share of its book. Therefore the current ~$100+/share earnings power is closer to a durable baseline than a peak, and a low-double-digit multiple on it is too cheap.
The counter (bear): Memory is the most cyclical industry in technology. An 84.6% gross margin is, by definition, a cyclical peak — every prior peak (2018, 2022) lasted 2–4 quarters before margins collapsed to single digits or negative. Supply always arrives (2027–2028 fabs + China's CXMT), the SCAs floor only ~25% of bits, and the stock at a ~$1.4T cap on peak earnings is a classic late-cycle trap.
The DD is the adjudication of those two statements. The evidence (below) says the bull is more right than in any prior cycle — but "different" means a higher, profitable trough, not the end of the cycle, and the stock price has already traveled most of the way to discounting the good version.
2. What Just Happened — Fiscal Q3 2026 (ended May 28, 2026)
Micron reported the single best quarter in its 47-year history and guided to an even better one:
| Metric | FQ3-26 (GAAP) | FQ2-26 | FQ3-25 (YoY) | FQ4-26 Guide |
|---|---|---|---|---|
| Revenue | $41.46B | $23.86B | $9.30B (+346%) | $50.0B ± $1.0B |
| Gross margin | 84.6% | 74.4% | 37.7% | ~86% |
| Operating margin | 80.4% | 67.6% | 23.3% | ~82% |
| Net income | $28.24B | $13.79B | $1.89B | ~$35.1B |
| Diluted EPS | $24.67 | $12.07 | $1.68 | $30.73 ± $1.00 |
| Operating cash flow | $25.39B | $11.90B | $4.61B | — |
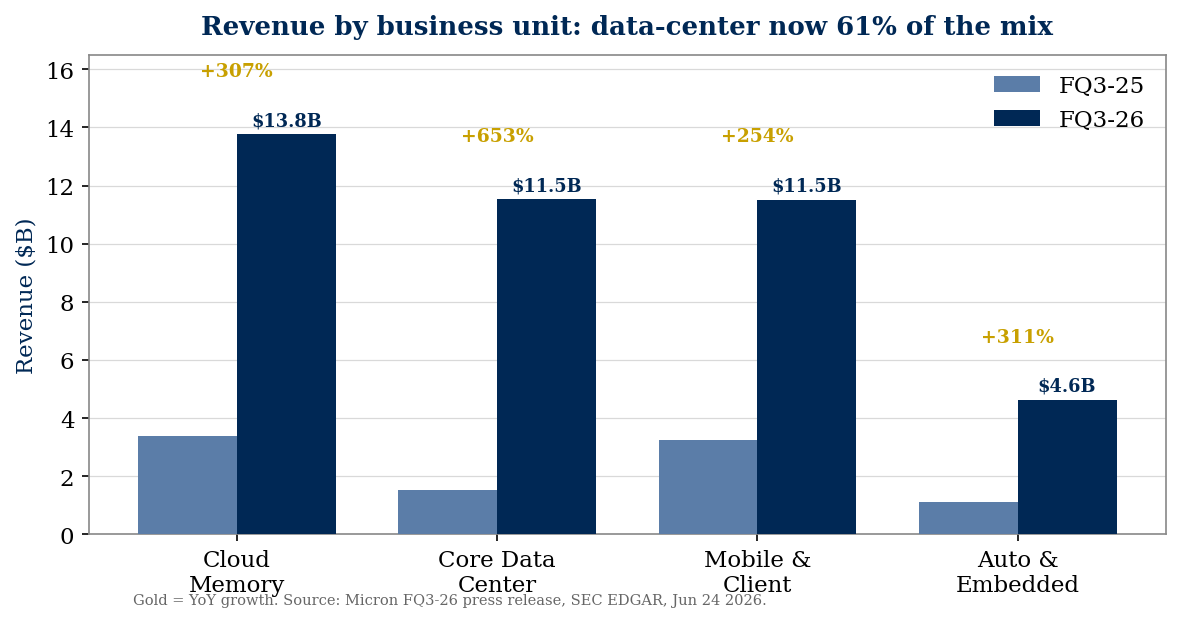
The mix shift is the story: data-center-exposed revenue (Cloud Memory + Core Data Center) is now 61% of the company, with Core Data Center up 7.5× YoY.
Management framed it directly (Sanjay Mehrotra, CEO): "Micron's record fiscal Q3 financial results and even stronger outlook for Q4 reflect the strategic value of memory in the AI era… our multi-year Strategic Customer Agreements will significantly enhance the durability and predictability of Micron's strong financial performance."
3. Financial Analysis
3.1 Revenue Overview (5-year)
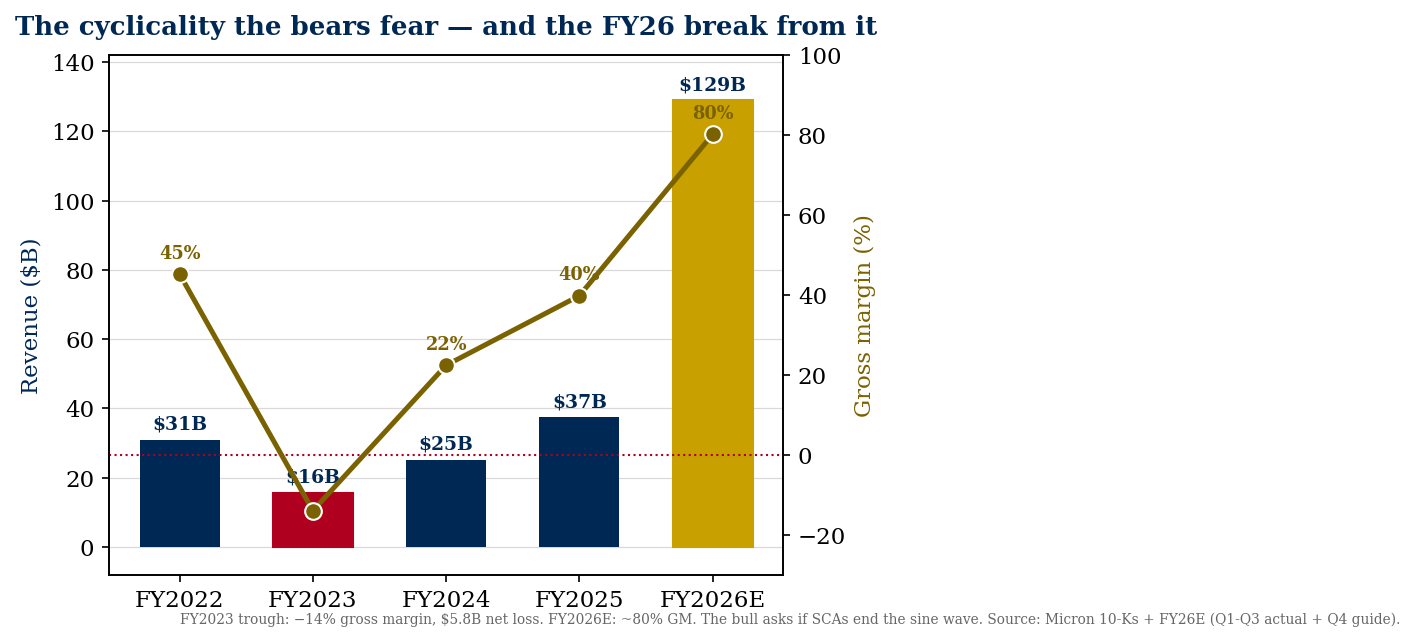
| FY (GAAP, $M) | FY2022 | FY2023 | FY2024 | FY2025 | FY2026E |
|---|---|---|---|---|---|
| Revenue | 30,758 | 15,540 | 25,111 | 37,378 | ~128,959 |
| Gross margin % | 45.2% | (14.0%) | 22.4% | 39.8% | ~80.2% |
| Operating margin % | 31.3% | (37.0%) | 5.2% | 26.1% | ~70.5% |
| Net income | 8,687 | (5,833) | 778 | 8,539 | ~82,400 |
| Diluted EPS | $7.75 | $(5.34) | $0.70 | $7.59 | ~$72.0 |
FY2026E = three reported quarters + the Q4 guide midpoint. The single most important context line in this entire DD: two years ago (FY2024) Micron earned $0.70/share; in FY2023 it lost $5.34/share with a negative gross margin. The leap to a ~$72 FY26 / ~$123 Q4-run-rate EPS is unprecedented — which is precisely why the bull/bear question is durability, not direction.
3.2 Business Anatomy (segment detail — the key exhibit)
| Business Unit | FQ3-26 Rev | % of total | YoY | GM% | OM% | What it is |
|---|---|---|---|---|---|---|
| Cloud Memory | $13,769M | 33.2% | +307% | 83% | 78% | HBM + high-capacity DIMMs to hyperscalers — the AI core |
| Core Data Center | $11,524M | 27.8% | +653% | 87% | 83% | Server DRAM + data-center SSD/NAND — fastest grower |
| Mobile & Client | $11,521M | 27.8% | +254% | 87% | 86% | Phone/PC DRAM + NAND — riding the broad shortage |
| Automotive & Embedded | $4,634M | 11.2% | +311% | 79% | 75% | Auto/industrial/edge |
| Total | $41,456M | 100% | +346% | 84.6% | 80.4% |
Every business unit is printing 79–87% gross margins — proof the shortage is broad, not HBM-only. Revenue quality scorecard: the highest-margin, most-contracted revenue (Cloud Memory / HBM) is also the fastest-growing and the most supply-constrained — an unusually high-quality mix for a memory company. The risk to quality is that ~75% of bits remain spot-priced (see §6).
3.3 Margin Architecture — why 84.6%
The margin move is almost pure price, not cost: from FQ3-25 → FQ3-26 revenue rose +346% while COGS rose only +10.5% ($5.79B → $6.40B). Operating expenses are now just 4.2% of revenue (down from 14.4%), so every incremental revenue dollar at ~85% gross margin drops almost entirely to operating income — textbook memory operating leverage, amplified by the AI shortage. The mechanism is the wafer-cannibalization effect (§4): HBM diverts wafers, starving commodity DRAM, lifting ASPs across the whole portfolio.
3.4 Cash Generation & Capital Allocation
- FQ3-26: $25.4B operating cash flow, $7.1B net capex, $18.3B adjusted FCF.
- Capital allocation priority = capacity + deleveraging, not returns. 9-mo capex $19.6B; debt repaid $9.4B (long-term debt $14.0B → $5.1B). Buybacks minimal (~$0.65B). Dividend a token $0.15/qtr (~0.06% yield).
- Capex is stepping up hard into the shortage: FY26 ~$27B; FY27 guided above the mid-$40B range, >half the increase from new fab construction. This is the double-edged sword: it funds the bull case (more HBM) and seeds the bear case (the next glut).
- Quality-of-earnings flags (two, offsetting): (1) 9-mo operating cash flow ($45.7B) lagged net income ($47.3B) because receivables ballooned $20B (to $31.0B) — DSO ~68 days, a working-capital drag from hyper-growth (watch for any SCA-related revenue pull-forward, though no evidence of channel-stuffing given lean inventory). (2) Working the other way, the
$22B SCA upfront customer cash ($18B cash) is booked as a deferred liability — the ~$7.3B build in other current/noncurrent liabilities this year is largely this — which buoys operating cash flow with a financing-like inflow. Net: reported OCF/FCF flatters true operating conversion on the upfront, while receivables drag it the other way. The upfront is also an obligation (Micron must deliver future product at collared — potentially below-spot — prices, and the cash is returnable/decrementable), not a free asset.
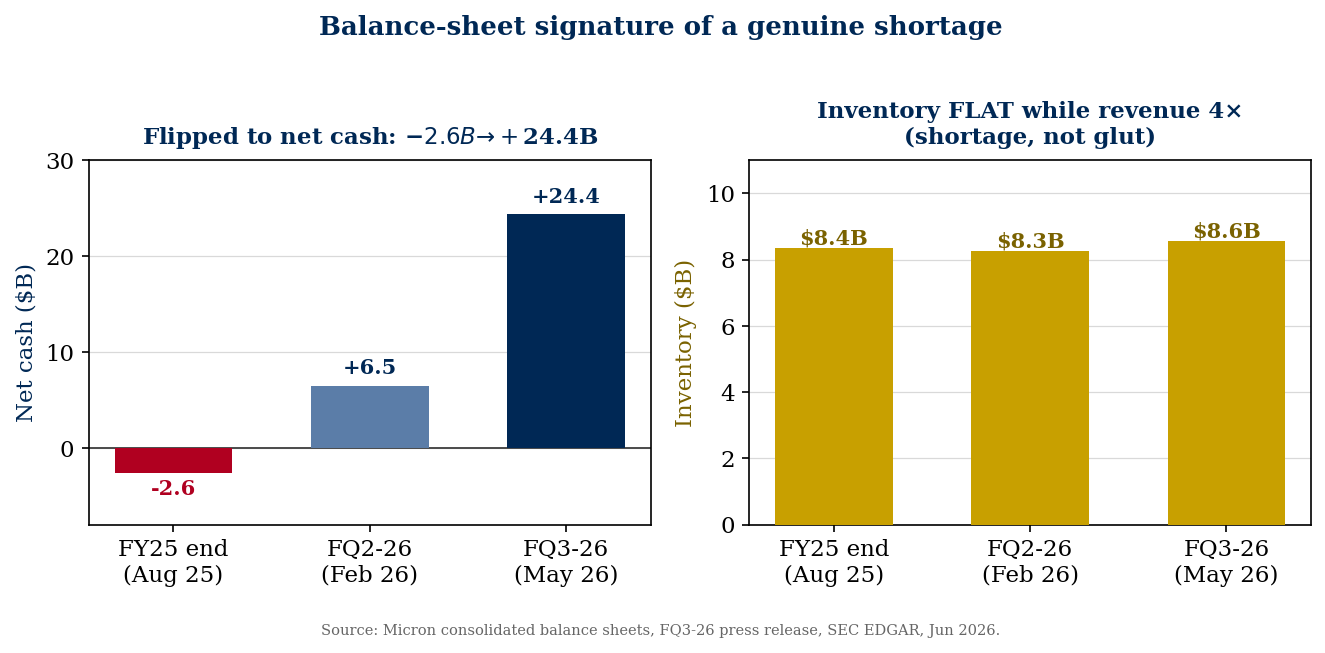
3.5 Balance Sheet — Fortress
| ($M) | FQ3-26 | FY25 end |
|---|---|---|
| Cash + investments | 30,128 | 11,936 |
| Total debt | 5,722 | 14,577 |
| Net cash | +24,406 | (2,641) |
| Inventories | 8,567 | 8,355 |
| Total equity | 100,724 | 54,165 |
Verdict: FORTRESS, rapidly de-risking. Flipped from net debt to +$24.4B net cash in three quarters; debt/equity just 5.7%. The critical tell: inventory is flat at $8.6B while revenue quadrupled — Micron is supply-constrained, not glutting. Lean inventory into rising prices is the bullish memory-cycle signature (the opposite of the FY2022 pre-crash setup, when inventories hit 31 weeks).
3.6 Forward Outlook
- Company guidance (Q4 FY26): $50B ± $1B revenue (+21% QoQ, ~17% above Street), ~86% GM, $30.73 EPS.
- Analyst consensus: Strong Buy (24+ buy / 2 hold / 0 sell); avg PT ~$1,127–$1,297 (max $2,000, min $249). FY27 consensus EPS ~$97.77 and revising up; Cantor's CJ Muse models a 2027 squeeze powering earnings through 2028 with a bull-case EPS to $200.
- Key assumption: consensus FY27 ($97.77) was largely set before the Q3 blowout + SCA disclosure — treat it as a floor likely to rise, but anchored to "shortage persists into 2027" (which the pricing tape and HBM sold-out status support).
4. The Memory Bottleneck — Supply Structure
The structural thesis, verified point-by-point:
- Three providers — CONFIRMED. DRAM ≈ Samsung 38.6% / SK Hynix 28.8% / Micron 22.4% = ~90% of revenue (~94–95% of bits). HBM is a tighter club: SK Hynix ~57–62% / Micron ~20% / Samsung ~17–25%, with no qualified fourth entrant. Consolidation from ~20 players (1990s) to 3 is why capital discipline now holds — all three are pulling the same HBM-mix lever (tightening supply), none is flooding bits.
- No new fabs until ~2028 — TRUE in substance. First incremental greenfield wafers = Micron Idaho ID1 in 2H2027 (ramps into 2028); Samsung P5 mass production late 2028; Micron's New York megafab slipped to ~2030. Greenfield lead time is ~3–4 years, so 2026–2027 wafer supply is effectively fixed. Corroborated independently by IDC and Intel's CEO ("no relief until 2028"). Qualifier: a little relief leaks into 2H2027, and node migration adds some bit-density — but HBM eats that (below).
- HBM cannibalization — the strongest pillar. HBM consumes ~3× the wafers per bit vs DDR5 (worsening to ~4× for HBM4) and now eats ~23% of all DRAM wafers (up from 19% in 2025). Every HBM bit removes ~3 commodity bits, so the AI ramp tightens the entire DRAM market — the HBM deficit actually widens 5%→6%→9% (2025→27) before new fabs arrive. This is the mechanism behind the 84.6% blended margin.
- Capital discipline — holding, even Samsung. 2026 capex is going to process upgrades + HBM, not greenfield bit-growth. The historical aggressor (Samsung) is funding a ~50% HBM surge by reallocating commodity wafers — which made the shortage worse, not better.
- Technology moat = the qualification wall. All three are NVIDIA-HBM4-qualified for Vera Rubin, but they are the only three qualified. Micron's edge is power-per-bit leadership (1-gamma EUV: ~30% higher density, >20% lower power) — the metric that matters most in a watt-constrained data center, and how Micron overtook Samsung for #2 in HBM.
5. The Demand Thesis — "Token-Maxing 0.1% → 5%"
The framing: "Token-maxing" = running continuous, agentic, long-running AI at max intensity (enterprise Cloud Code/Codex/agent loops — not the throttled $20 consumer tier). The on-record penetration anchor: "less than 0.2% of people on Earth are using AI in an agentic way" (Andrew Fox / Whale Rock, BG2). Aravind Srinivas corroborates with a single Perplexity power user spending $10,000/month. Going from ~0.1–0.2% to 5% is a 25–50× increase in the most memory-intensive cohort.
Why the memory delta is larger than the headcount multiplier — three stacking effects:
- Intensity: the cohort growing is the highest-token-consuming one.
- The memory wall: reasoning + long-running agents are memory-bandwidth-bound — the KV cache ("working memory") scales with context length × concurrent agents and lives in HBM. Gavin Baker: reasoning models proved "how much more compute-hungry [they] are during inference." Run out of HBM and the GPU stalls regardless of FLOPs.
- Content growth: per-GPU HBM keeps rising (H100 80GB → H200 141GB → B200 192GB → B300/Rubin ~288GB), so memory demand grows faster than GPU units.
Sizing the delta (scenario, not forecast): Micron's own model already pulls HBM TAM from ~$35B (2025) to ~$100B (2028) — pulled forward two years — on penetration that is likely still ~1%. A move toward 5% breaks the current models to the upside. The honest statement: you cannot cleanly size 5% because supply becomes the binding constraint long before 5% — and that constraint is exactly Micron's pricing power. The delta shows up as sustained 80%+ gross margins and a TAM that keeps getting pulled forward, not a clean unit number. At ~20–25% HBM share, Micron's HBM business alone trends to ~$20–30B by 2028, before the cannibalization-driven commodity uplift.
The demand cross-check (the money that pulls the memory): inference revenue >$200B in 2025 heading to "trillions before 2030" (Dario Amodei); hyperscaler capex >$700B in 2026 toward >$1T in 2027; and — contra consensus — token monetization per gigawatt is rising ($20B → $40B/GW/yr), not falling. Open source winning on token volume is bullish for memory, not bearish: "the better open source does… the more you'll spend on compute" (Baker).
6. The Strategic Customer Agreements & the Cycle-Break Question
This is the hinge of the whole investment — and the part most analyses skip. Here is the pricing mechanism, decoded:
The SCAs (decoded):
- 16 non-cancelable, take-or-pay agreements = ~$100B minimum contracted revenue, backed by $22B+ upfront commitments (~$18B cash), returned back-end-loaded and decrementable for non-performance (real collateral).
- 5-year terms (auto-renewing 3-yr), booked through calendar 2030.
- The pricing is a PRICE COLLAR — a ceiling AND a floor. Verbatim from the call: "a price ceiling and a price floor… price gets negotiated every quarter based on market conditions. The price cannot exceed the ceiling no matter what, cannot go below the floor no matter what." Floors are set off today's record prices; advanced products (HBM, DDR6) carry higher tiers. The floor does the cycle-defense; the ceiling is the concession Micron gave to win the floor.
- Covers ~20% of DRAM bits / ~⅓ of NAND bits ≈ 25% of revenue today, with a stated target of ~50% of revenue.
Why this de-risks the bear case (the math): Historically memory had no long-term contracts — pure spot pricing on a commodity three firms all make → gross margins swing from +60% to negative (FY2018 ~61% → FQ3-FY2023 −17.8%). The SCAs put a hard floor + cash collateral under the highest-margin, leading-edge slice of the book, truncating the negative-margin left tail. In the next downturn, ~25% of the book keeps clearing near peak while only the uncommitted ~75% re-prices to spot — arithmetically a higher, less-violent trough.
Historical super-cycle comparison — what the bull must overcome:
| Cycle | Revenue | Gross Margin | Net Income | Note |
|---|---|---|---|---|
| FY2018 peak | $30.4B | ~59–61% | +$14.1B | Record GM held only ~4 quarters |
| FY2019 bust | $23.4B | ~46% | +$6.3B | GM ~halved in 3–4 quarters |
| FY2022 peak | $30.8B | ~45% | +$8.7B | Record revenue, then collapse |
| FY2023 trough | $15.5B | −9.1% (FQ3 −17.8%) | −$5.8B | Negative GM, multi-$B loss; ~−50% stock |
| FY2024 | $25.1B | 22.4% | +$0.8B | AI inflection begins |
| FY2025 | $37.4B | 39.8% | +$8.5B | Recovery |
| FY2026 | ~$129B | 84.6% (FQ3) | +$82B est. | The cycle in question; GM ~2× the prior peak |
The honest synthesis: SCAs are a genuine, first-of-its-kind structural improvement that makes a repeat of FY2023's loss far less likely. But they do not make Micron a non-cyclical utility: ~75% of bits still ride the commodity cycle, the floors are untested (a floor set off 2026 records is far above a 2028 trough — maximizing renegotiation incentive), and Micron's own record capex is the seed of the next correction, arriving in 2027–2028 exactly when the floors first get tested. "This time is different" resolves to "the trough is higher and profitable," not "the cycle is over."
The current pricing tape backs the bull today: DRAM contract prices +95% QoQ (1Q26) then +58–63% (2Q26); NAND +33–38% then +70–75%; HBM sold out through 2026 and largely 2027. The one yellow flag: spot momentum is moderating (stabilizing at record highs) — spot is the earliest place a rollover would show.
7. Valuation & the P/E Suite
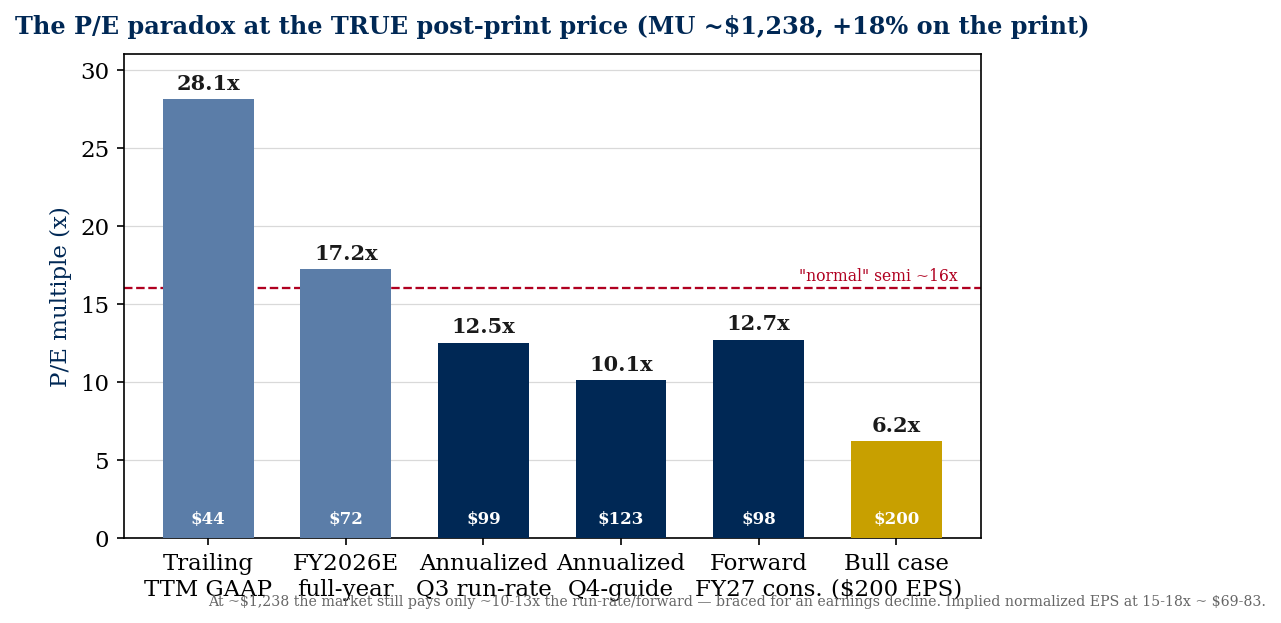
At ~$1,238 / ~$1.41T cap / ~1.145B diluted shares (post-print — the stock gapped ~+18% on the report; $1,049 was the pre-print close):
| Basis | EPS | P/E | Read |
|---|---|---|---|
| (a) Trailing TTM GAAP | ~$44.0 | ~28.1× | Expensive |
| (b) FY2026E full-year GAAP | ~$72.0 | ~17.2× | Full |
| (c) Annualized Q3 run-rate ($24.67×4) | $98.68 | ~12.5× | Modest |
| (d) Annualized Q4-guide run-rate ($30.73×4) | $122.92 | ~10.1× | Cheap-looking |
| (e) Forward consensus FY2027 | ~$97.77 (rising) | ~12.7× | Modest |
| (f) Bull case (Cantor) | $200 | ~6.2× | "Free" if true |
What the market is implying (the crux): even after the +18% gap, a low-teens forward multiple is not the market saying "cheap" — it is the market saying "I don't believe these earnings last." To justify ~$1,238 at a normal semiconductor multiple of 15–18×, the implied normalized through-cycle EPS is only ~$69–83 — roughly two-thirds of the current run-rate. So:
- Bears are right that 10× on peak earnings is a classic late-cycle trap (you capitalize a number that mean-reverts).
- Bulls are right that if the SCAs + structural shortage make ~$100 EPS durable, then 10× is far too cheap and the stock re-rates to mid-teens (→ ~$1,500–1,950). This is exactly Gavin Baker's pound-the-table mispricing call: "semi-cap equipment companies trading at 40 times… and DRAM companies trading at mid-single digit… Those can't both be true" (Watts & Wafers, §12).
- The reconciliation: the market is "braced for the down-cycle — and possibly not braced enough." The forward multiple already embeds a normalization; the question is whether the degree of normalization the market assumes (~half) is too much (bull) or too little (bear).
The "potential delta" from the contracts: the ~$100B of SCA minimum revenue ≈ ~$20B/yr floored (~25% of revenue) at near-peak margins. That doesn't change the peak — it changes the trough. The delta is asymmetric and shows up in down-years: instead of revenue halving (FY22→FY23) with margins going negative, the floored slice (the highest-margin HBM/leading-edge product) holds, so a future trough is plausibly profitable rather than loss-making. That is worth a higher trough multiple and a higher normalized EPS — but the market will only pay for it once a downturn proves the floors hold.
8. Bull / Base / Bear Scenarios
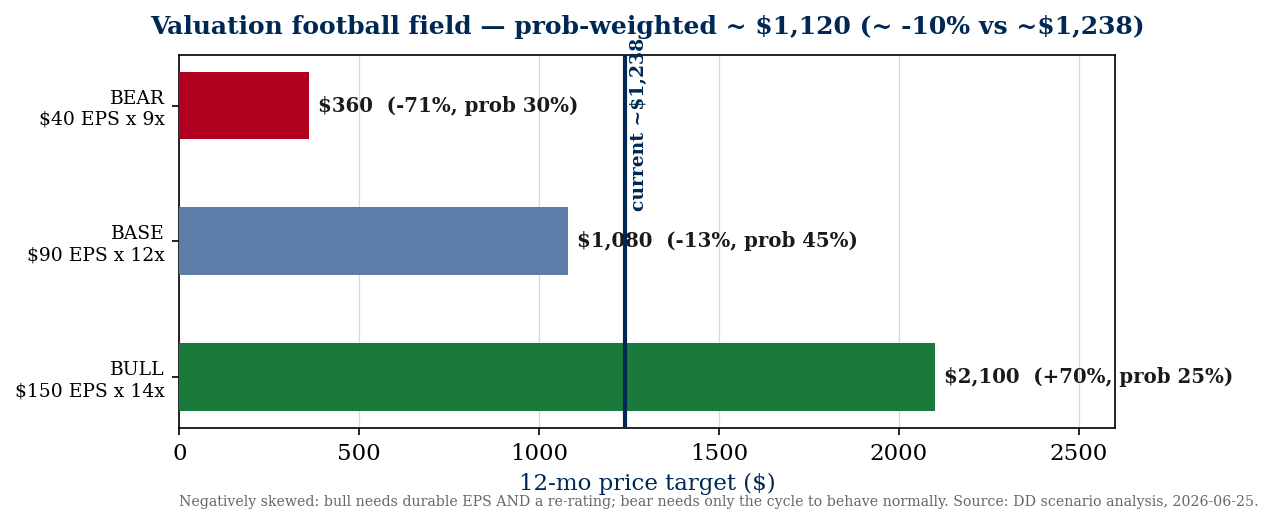
| Scenario | FY27 EPS | Exit multiple | Price target | Return vs ~$1,238 | Prob. |
|---|---|---|---|---|---|
| Bull | $150 (above the $123 run-rate — 5% token-maxing, shortage to 2028, SCAs at ~50%) | 14× (re-rate) | ~$2,100 | +70% | 25% |
| Base | $90 (normalizes off the run-rate as 2027–28 supply arrives, but SCAs + shortage hold most) | 12× | ~$1,080 | −13% | 45% |
| Bear | $40 (cycle rolls; ~75% spot reprices down; floors hold the other ~25% → profitable, not a loss) | 9× | ~$360 | −71% | 30% |
Probability-weighted fair value ≈ ~$1,120 → ~−10% from ~$1,238 (range −10% to −13% depending on the base-EPS assumption).
Calibration (post-red-team, single committed weighting): The earlier draft valued these scenarios at the pre-print $1,049; correcting to the true $25–35, a 2028 CXMT-led commodity reset cracks even the contracted book); $40 blends them. The single most important unresolved variable remains FY27 normalization ($75 vs $95), which swings the prob-weighted return a few points but not the sign. The asymmetry is the takeaway: the bull needs two correlated bets (EPS stays near-peak AND the multiple re-rates from ~10–13× to mid-teens); the bear needs only the industry to behave as it always has.$1,238 turns the base case negative (−13%) and the prob-weighted return clearly negative, not "flat." Two deliberate calibrations: (1) the bull EPS is set at $150 — above the $123 Q4 run-rate — so the bull is a genuine growth+re-rate case, not a disguised base (the prior $130 was barely above run-rate); (2) the bear is conditional — a true bear splits into floors-hold ($45–55 EPS, the SCAs do their job) and floors-fail (
Sensitivity matrix (price = FY27 EPS × multiple):
| EPS ↓ / Multiple → | 8× | 12× | 16× | 20× |
|---|---|---|---|---|
| $40 | $320 | $480 | $640 | $800 |
| $70 | $560 | $840 | $1,120 | $1,400 |
| $100 | $800 | $1,200 | $1,600 | $2,000 |
| $130 | $1,040 | $1,560 | $2,080 | $2,600 |
| $200 | $1,600 | $2,400 | $3,200 | $4,000 |
The current ~$1,238 sits at roughly $100 EPS × 12.4× (or the $123 run-rate × ~10×) — i.e., the market is paying a modest multiple on near-peak earnings. You make money if earnings hold AND the multiple rises; you lose badly if earnings normalize toward $40–70 at a trough multiple. Note the cell nearest the current price ($100 × 12×) is already a −3% outcome — the stock needs the bull row to work just to beat cash.
9. Risk Register (ranked by likelihood × impact)
- Cyclicality / margin mean-reversion (HIGH / HIGH — the #1 risk). An 84.6% gross margin is a cyclical peak by definition; prior peaks lasted 2–4 quarters. The most dangerous moment in memory historically arrives exactly when margins peak and the stock looks "cheap" on forward earnings. The asymmetry is the whole point: the bull needs two correlated bets to win; the bear needs only the base rate. The most authoritative statement of this risk comes from the customer himself — Jensen Huang: "None of the bottlenecks last longer than a couple, two, three years. None of them." A sub-risk inside this: an efficiency breakthrough ("another DeepSeek moment," Coatue's #1 watched risk) that cuts the memory required per unit of intelligence — the demand-side mirror of supply normalization.
- Supply response — Samsung + China/CXMT (MED-HIGH / HIGH). The #1 structural supply risk is CXMT, which reaches ~17% of global DRAM (~500 kwspm) by 2028 with state-backed, share-insensitive commodity capacity — the one actor the rational oligopoly cannot discipline. If AI demand decelerates while CXMT floods the low end, the commodity-DRAM floor that backstops Micron's blended margin could reset post-2028, decoupled from HBM. Samsung pivoting to aggressive expansion is the internal-to-oligopoly version (not currently happening).
- Customer concentration + AI capex digestion (MED / HIGH). Micron's customers are a handful of hyperscalers + NVIDIA, and the highest-margin book — HBM — is heavily NVIDIA-linked (HBM4 for the Vera Rubin platform; SK Hynix retains the lead allocation). A NVIDIA roadmap slip, an allocation shift toward SK Hynix, or any pause in the AI capex super-cycle (a "digestion" year, neocloud funding tightening, an ROI scare) hits memory first and hardest, since memory is the marginal, most-elastic line item.
- SCA counterparty / floor-enforceability risk (MED / HIGH). The floors are untested and set off record prices; in a deep downturn counterparties have maximal incentive to renegotiate, and no public MAC/renegotiation language exists. The $18B cash collateral mitigates but does not eliminate this. If the floors bend, the central bull pillar weakens.
- HBM technology-transition risk (MED / MED). SK Hynix leads HBM (~57–62%) and was first to HBM4. A stumble in Micron's HBM4/HBM4E qualification or yield (1-gamma EUV ramp) would cost share in the highest-margin, fastest-growing segment.
- Capital-intensity / capex-into-the-peak (MED / MED). FY27 capex >mid-$40B. Memory capex always peaks into the downturn; if demand softens after the spend, fixed depreciation gets spread over collapsing revenue — the operating leverage that's a tailwind now becomes a vicious headwind.
- Valuation / multiple compression (MED / MED). A ~$1.4T cap on peak earnings; if sentiment shifts from "structural" to "cyclical peak," the multiple compresses even if earnings hold — the 2018 playbook.
- Geopolitics (LOW-MED / HIGH-tail). Taiwan/Korea concentration, China export controls, tariffs, and CHIPS-Act dynamics are tail risks that could disrupt either supply or demand abruptly.
- NAND softness (LOW / LOW-MED). NAND is the weaker, more commoditized half; a NAND-specific glut would dent the blended picture but is secondary to DRAM/HBM.
- Insider selling — sentiment flag (LOW-MED / signal-only). >$85M of executive selling in the trailing 90 days: CEO Mehrotra sold ~$21.5M (May 1, ~$520) and ~$38M (May 29, ~$950 — near all-time highs), with further sales by Arnzen (100k sh), Ray (36.6k), and Deboer (145k). All under pre-arranged 10b5-1 plans (insulated from timing claims), but a cluster of insiders monetizing heavily into the run is a classic late-cycle tell worth weighing against the structural bull narrative.
10. 7 Powers Analysis (Hamilton Helmer)
| Power | Status | Evidence |
|---|---|---|
| Scale Economies | Present | DRAM is brutally scale-driven; leading-edge fabs cost $15–20B+ and only three firms can amortize them. Micron's $56B PP&E and node-migration cadence (1-gamma EUV) compound a cost-per-bit advantage. |
| Cornered Resource | Emerging | Two senses: (a) NVIDIA HBM4 qualification — only 3 firms inside the wall, and Micron's power-per-bit edge is a genuine co-design asset; (b) the SCAs themselves corner ~$100B of customer commitment + $18B cash. Neither is permanent, but both are scarce. |
| Counter-Positioning | Absent | All three players have the same model; no incumbent is structurally prevented from copying Micron. |
| Switching Costs | Emerging | HBM is deeply co-designed with the customer's accelerator (qualification takes years); the multi-year take-or-pay SCAs are contractual switching costs. Commodity DRAM has none. |
| Network Economies | Absent | No network effect in memory. |
| Process Power | Present | Decades of yield-learning, EUV process integration, and HBM stacking/TSV know-how are embedded organizational capability that took years to build — the reason CXMT is ~a decade behind on HBM. |
| Branding | Absent | Memory is sold on spec/price/qualification, not brand premium. |
Overall: Micron's durable powers are Scale Economies + Process Power, freshly augmented by an Emerging Cornered Resource / Switching Cost via HBM qualification and the SCAs. Durability verdict: MEDIUM-HIGH for the franchise. The moat is the oligopoly structure + the qualification wall — real and rising — but it is a cost/structure moat in a commodity product, so it caps the trough, it does not eliminate the cycle. The key variable: whether the SCAs convert "emerging" switching costs into "present" ones across enough of the book.
11. Investor Lens
Warren Buffett
- Moat: A genuine oligopoly with scale + process power — but in a commodity. Buffett historically avoids commodity producers (he'd note that "in a business selling a commodity product, you can't be a lot smarter than your dumbest competitor"). The SCAs are the first thing that would interest him — contracted, collateralized cash flows are un-commodity-like.
- Management: Mehrotra is well-regarded, disciplined (deleveraging into the boom, capacity over buybacks). Owner-oriented enough.
- Economics: Today's owner earnings are spectacular; through-cycle they are mediocre-to-volatile. A "child could run it" — no; it requires constant multi-billion reinvestment just to stand still.
- Margin of safety: None at ~$1,238 (and even less after the +18% gap). Buying a cyclical at ~28× trailing / peak margins is the opposite of margin of safety. Buffett buys cyclicals at the trough on low prices and high P/Es (no earnings), not at the peak on high prices and low P/Es.
- Verdict: PASS / WATCHLIST. "I'd rather buy a wonderful business at a fair price than a fair business at a wonderful price — and a memory maker at a cyclical peak is a fair business at a price the crowd thinks is wonderful."
Peter Thiel
- Monopoly test: Not a monopoly — a 3-player oligopoly. But in HBM, it's a 3-firm club with a years-deep qualification moat and one clear bottleneck. Closer to "one of a handful that matter" than most.
- Secret: The contrarian truth Micron is acting on — memory, not logic, is the binding AI constraint, and you can contractually defend the trough — is exactly the kind of non-consensus insight Thiel prizes. The SCAs are a "definite plan," not iteration.
- Technology leverage: Power-per-bit leadership is real but incremental (~20–30%), not a 10× discontinuity.
- Power law: Memory is a great cyclical, not a power-law compounder — it doesn't return a fund 100×.
- Verdict: INTERESTING BUT… not a venture-style bet. "It's a real bottleneck and a definite plan — but it's a toll booth on someone else's road, and toll booths get re-priced when the road gets widened in 2028."
Agree / Disagree
| Dimension | Buffett | Thiel | Signal |
|---|---|---|---|
| Overall | PASS/WATCHLIST | INTERESTING-BUT | Both cautious — neither a screaming buy at ~$1,238 |
| Biggest strength | The SCAs (contracted cash) | The bottleneck insight + definite plan | Different angles, same object |
| Biggest concern | No margin of safety at peak | Toll-booth, not a compounder; re-priced in 2028 | Both point at durability/entry |
| Time horizon | Forever (but not here) | 5-yr until supply normalizes | Misaligned with a "hold forever" |
Synthesis: Two very different legends both land cautious at this price for different reasons — Buffett on margin-of-safety, Thiel on it being a re-pricable toll booth rather than a compounder. That convergence is a meaningful caution signal on the stock, even as both would acknowledge the fundamental thesis (memory is the bottleneck) is correct.
12. Teahose Signal — Gavin Baker & the Smart-Money Corpus
The proprietary edge: the Teahose corpus shows the sharpest AI-compute investors independently arriving at the memory-bottleneck thesis before this quarter confirmed it — and Gavin Baker's commentary is the most direct of all.
Gavin Baker (Atreides CIO) — the bull, in his own words:
- The mispricing thesis (Watts & Wafers, ILTB EP.473, transcript [01:00:09]): "I don't know anyone like me who's not really bullish on DRAM… you have semi-cap equipment companies trading at 40 times… and DRAM companies trading at mid-single digit… Those can't both be true." — This is the bull case for owning Micron over the rest of the AI-semi complex, and it speaks directly to the P/E paradox in §7: a mid-single-digit run-rate multiple on the scarcest input is the anomaly Baker is pounding the table on.
- The super-cycle framing (AI Chip Wars, transcript [01:09:27]): "Our first true DRAM cycle since the late 90s… if it starts to go up by x's instead of percentages, that's a whole different game." That is precisely what FQ3-26 delivered — revenue went up by multiples, not percentages.
- The physics (AI Chip Wars [00:42:51]): inference is memory-bound on both axes — pre-fill is capacity-bound, decode is bandwidth-bound — the technical core of "memory is the bottleneck." Reasoning models are "far more compute-hungry during inference," and the broader watts-and-wafers frame is that AI is governed by two physical constraints, with the wafer (memory/logic capacity) constraint the more consequential.
Other smart-money corroboration:
- Aravind Srinivas (Perplexity), 20VC, 2026-06-15 — the explicit price call: "It might not be inconceivable that Micron, the supplier of HBMs, might be more valuable than Meta in the next six to 12 months. It's already at like a trillion." Micron has since gapped to ~$1.4T — squarely into the $1.3–1.4T Meta range the call referenced, in real time. His frame: "whatever is the bottleneck commands the price."
- Coatue (Jaimin Rangwalla), Sourcery — the "sellers of shortage" data: Micron's operating margin went 16% → 69% (≈4×); "sellers of shortage" (incl. Micron) returned ~107% YTD vs. buyers ~4%; memory suppliers are signing supply commitments through 2029–2030 — Coatue's word for it is "structural, not cyclical."
- BG2 (Baker / Fox / Tang), 2026-06-11 — the demand anchor: "Less than 0.2% of people on Earth are actually using AI in an agentic way" (the 0.1%→5% anchor), with token monetization per gigawatt rising $20B → $40B — demand "barely switched on."
Where the same corpus flags caution (intellectual honesty):
- Jensen Huang (Dwarkesh, [00:15:09]) — the most authoritative bear counterpoint: "None of the bottlenecks last longer than a couple, two, three years. None of them." The man who controls the demand and masters the supply chain is on record that shortages self-correct — i.e., the super-cycle is violent but time-boxed, which is the §9 cyclicality risk stated by the best possible source.
- Gavin Baker's own bear case — edge AI (AI Chip Wars [00:52:03]): pruned frontier models running locally "at a 115 IQ, 30–60 tokens/sec… and that's free… clearly Apple's strategy" could hollow out cloud HBM demand in ~3 years (mitigant: edge devices still need on-device DRAM).
- StrictlyVC, 2026-06-24 (yesterday) — the beta reality: the SOX fell −7.9% with Micron sliding on "debt-funded AI spending" + a hawkish Fed — memory trades as a high-beta cyclical regardless of the structural story. Coatue's own #1 watched risk: "another DeepSeek moment" — an efficiency breakthrough that cuts the memory needed per unit of intelligence.
Net read of the corpus: near-unanimous that memory/Micron is THE mispriced AI bottleneck with multi-year, oligopoly-priced, increasingly-contracted demand — but equally clear that memory is the highest-beta, most cyclical expression of the AI trade, exposed to efficiency breakthroughs, 2–3-year supply normalization (Jensen), edge AI (Baker), and the deeper power/permitting ceiling (Srinivas). The smart money is bullish on the bottleneck and respectful of the beta — exactly the posture §13 lands on.
13. Go / No-Go Assessment
Recommendation: BUY-THE-FRANCHISE / MIND-THE-ENTRY — a qualified, sized position, not a max-conviction buy at ~$1,238 after the +18% gap.
Top 3 reasons the thesis is real:
- The bottleneck is verified and structural — 3 providers, fixed supply to 2028, HBM cannibalizing the whole market. This is not a normal cycle's demand spike; it's a supply-locked, AI-driven, multi-year shortage.
- The SCAs genuinely change the asset — for the first time, hard price floors + $18B cash collateral truncate the catastrophic-loss left tail. A FY2023-style disaster is materially less likely.
- The balance sheet and cash generation are pristine — $24B net cash, lean inventory, $18B/quarter FCF — Micron can fund the capacity bet from cash and weather a downturn from strength.
Top 3 risks if proceeding:
- You are buying at a cyclical peak — 84.6% margins mean-revert; the market's ~12.7× forward already says so, and it may not have said it loudly enough.
- The floors are untested and cover only ~25% of bits — the 2027–2028 supply wave (fabs + CXMT) tests them exactly when they matter.
- The upside is multiple-dependent — you need both durable earnings and a re-rating; the downside needs neither.
The valuation-honesty check (required): At ~12.7× forward / ~28× trailing, this stock is NOT cheap — it is priced for continued excellence with a discount for cyclicality. Anyone claiming MU is "undervalued" at ~$1,238 is implicitly betting the SCAs end the cycle, which the evidence says they only soften. The honest framing: you are paying a fair-to-full price for a genuinely improved, structurally-advantaged cyclical at the top of the best cycle in its history — the bet is that "improved" is worth more than the market's current ~$69–83 normalized-EPS assumption. Probability-weighted return at ~$1,238 is clearly negative (~−10% to −13%), with a wide, negatively-skewed distribution — the +18% print-day gap is precisely what tipped it from "flat" to "negative."
What would change the recommendation:
- More bullish → a pullback toward ~$800–900 (improves margin of safety to a clear buy); evidence the SCAs are being signed at ~50% of revenue with disclosed margin floors; a second consecutive quarter of rising contract prices into FY27.
- More bearish → spot DRAM rolling over (the leading indicator); CXMT HBM-qualifying or accelerating commodity adds; any hyperscaler capex guide-down; receivables/DSO continuing to balloon.
Net: There is a sound basis for staying bullish on the thesis — the bottleneck is real and Micron is its purest large-cap expression. But the DD's job is to separate "great company / great cycle" from "great stock at ~$1,238," and the honest answer is that the entry, not the thesis, is the weak link. Own it as the secular AI-memory winner; size it for the cyclicality; prefer adds on weakness.
14. Open Questions & Research Backlog
- (CRITICAL) Disclosed gross-margin floor in the SCAs? Management gave no explicit GM-floor number — only that floors "support margins above prior cycle peaks." The single most valuable disclosure for the bull case. Resolve: scour the 10-Q contract/RPO footnote + any 8-K; ask IR.
- (CRITICAL) FY27 normalization — the $75-vs-$95 EPS swing that flips probability-weighted return from −12% to ~flat. Resolve: track contract-price prints (TrendForce) through CY2026; watch the FY26 Q4 print + FY27 Q1 guide.
- (HIGH) CXMT HBM progress + commodity ramp pace. The key 2028 bear. Resolve: SemiAnalysis trackers; monitor CXMT yield/qual news.
- (HIGH) Spot DRAM rollover watch. The earliest leading indicator; currently "stabilizing at highs." Resolve: weekly TrendForce DataTrack spot index.
- (MED) SCA counterparty identities & renegotiation/MAC terms. Unnamed ("four large customers + hyperscalers"). Resolve: 10-Q, future 8-Ks.
- (MED) HBM4/HBM4E qualification milestones vs SK Hynix. Share trajectory in the highest-margin segment.
- (MED) Receivables/DSO normalization — does the $20B build convert to cash or signal channel risk?
The AI memory & semiconductor supply chain: companies like Micron
Live from the Teahose intel graph — companies most similar to Micron by sector and recent signal activity, updated as new signals land.
- 01SK HynixSemiconductors86% match
- 02MarvellSemiconductors79% match
- 03MediaTekSemiconductors76% match
- 04IntelSemiconductors76% match
- 05XCENASemiconductors76% match
- 06AMDSemiconductors76% match
- 07MextAI / Software76% match
- 08BroadcomAI76% match
- 09SeagateData Storage76% match
Related Teahose research
- AI chip companies to watch — the broader accelerator and silicon race Micron's memory feeds.
- NVIDIA competitors — the demand engine behind HBM, and who's chasing it.
- AI infrastructure companies — the power, compute and memory build-out in one map.
- Cerebras valuation — a wafer-scale alternative architecture in the same AI-compute fight.
Track the AI-memory supply chain. Find the companies most similar to Micron and get new funding, product and partnership signals by email as they land — the chart above is a snapshot; the live feed is ongoing.
Sources & methodology: built from Micron's SEC filings (the 10-Q and 8-K filed June 24–25, 2026), the fiscal Q3 2026 earnings call, and third-party memory-market data (TrendForce, Omdia, Counterpoint, SemiAnalysis), cross-referenced with the Teahose expert podcast corpus (1,150+ analyzed conversations). All figures as of June 25, 2026. This is analysis for informational purposes only and is not investment advice.
Frequently Asked Questions
Is Micron stock a buy after its Q3 2026 earnings?
It depends on your time horizon and entry. The fundamental thesis is strong — memory is the binding bottleneck in AI compute, and Micron has now locked in ~$100 billion of contracted revenue with hard price floors. But after an ~18% post-earnings jump to ~$1,238 (a ~$1.41 trillion market cap), the stock already prices much of that in. On a probability-weighted basis the risk/reward at this price is roughly flat-to-negative (about -10%), with a wide range. The honest read: it's a world-class way to own the AI-memory super-cycle, but the easy money was made below ~$1,050 — so size for the cyclicality and prefer adding on weakness. This is analysis, not investment advice.
What was Micron's Q3 fiscal 2026 revenue and EPS?
Micron reported $41.46 billion in revenue for fiscal Q3 2026 (the quarter ended May 28, 2026), up 346% year over year, with GAAP diluted EPS of $24.67 (non-GAAP $25.11) and a record 84.6% gross margin. It then guided fiscal Q4 to about $50 billion in revenue and $30.73 GAAP EPS at roughly 86% gross margin.
What is Micron's P/E ratio?
It depends entirely on which earnings you use — and that is the whole debate. At $1,238, Micron trades at roughly 28x trailing-twelve-month GAAP earnings ($44 EPS), but only 10x the annualized Q4-guide run-rate ($123) and 12.7x forward FY2027 consensus ($98). A ~10–13x forward multiple means the market is pricing an earnings decline — it implies a 'normalized' EPS of just ~$69–83, well below the current run-rate.
What is Micron's stock price target?
Wall Street's 12-month targets cluster around $1,100–$1,300 on a Strong Buy consensus, with outliers from ~$250 to ~$2,000, and some bulls (e.g., Cantor) model EPS as high as $200. Our own scenario analysis frames it as bull ~$2,100 (+70%), base ~$1,080 (-13%) and bear ~$360 (-71%) — a negatively-skewed, probability-weighted ~$1,120.
Why did Micron stock jump after earnings?
Micron beat on every line and guided sharply higher — Q4 revenue of ~$50 billion versus a ~$43 billion Street estimate, a record 84.6% gross margin, and, most importantly, the disclosure of 16 multi-year Strategic Customer Agreements worth ~$100 billion in minimum contracted revenue, which management says make earnings more 'durable and predictable.' The stock gapped roughly 18%.
Is the AI memory super-cycle a peak or sustainable?
Partly both. Micron has genuinely raised the trough for the first time in memory history via take-or-pay contracts with hard price floors covering ~25% of its book — so a repeat of fiscal 2023's -18% gross margin and $5.8 billion loss is now much less likely. But ~75% of bits still re-price to spot, the floors are untested, and new supply (greenfield fabs in 2027–28 plus China's CXMT) arrives just as those floors would first be tested. NVIDIA's Jensen Huang put it bluntly: 'None of the bottlenecks last longer than a couple, two, three years.' The verdict: a higher, profitable trough — not the end of the cycle.
What are Micron's Strategic Customer Agreements (SCAs)?
They are 16 non-cancelable, take-or-pay contracts representing ~$100 billion in minimum contracted revenue, backed by $22 billion in upfront customer commitments ($18 billion of it cash), running five years through calendar 2030. The pricing uses a collar — a floor and a ceiling — so prices float quarterly within a band but 'cannot go below the floor no matter what.' They cover ~25% of revenue today, with a stated target of ~50%.
What is HBM and why does it matter for Micron?
HBM (high-bandwidth memory) is the stacked DRAM that sits on AI accelerators like NVIDIA's GPUs. It matters two ways: it is Micron's highest-margin, fastest-growing product (sold out through 2026 and largely 2027), and it consumes roughly 3x the wafers per bit of standard DRAM — so the HBM ramp starves commodity-memory supply and lifts prices across Micron's entire portfolio. That is why blended gross margin hit 84.6%, not just HBM.
Micron vs NVIDIA vs SK Hynix — which is the better AI stock?
They are different bets. NVIDIA is the demand engine (and Micron's key HBM customer); SK Hynix is the HBM market leader (~57–62% share) and Micron's main rival; Micron (~20% HBM share, the #2 supplier) is the lower-multiple, higher-beta way to play the memory bottleneck. Micron's edge is power-per-bit leadership (its 1-gamma node), which is how it overtook Samsung for #2. Of the three, memory is the most cyclical.
What are the biggest risks to Micron stock?
Cyclicality is #1 — an 84.6% gross margin is a cyclical peak by definition, and prior peaks lasted only 2–4 quarters. Other risks: a China/CXMT commodity-DRAM flood by ~2028, AI-capex digestion, customer concentration (HBM is heavily NVIDIA-linked), untested SCA price floors, capex peaking into a potential downturn, and multiple compression at a ~$1.4 trillion cap on peak earnings. Insiders have also sold more than $85 million in the trailing 90 days (under pre-arranged 10b5-1 plans).
Can Micron stock reach $2,000?
Only in the bull scenario. That requires fiscal 2027 EPS holding near ~$130–150 (above today's run-rate, implying the AI-memory shortage extends through 2028 and the SCAs ramp toward ~50% of revenue) and a re-rating from ~10–13x to a mid-teens multiple. UBS and others have floated $1,625+ targets on exactly this logic. It is plausible, but it requires two correlated bets to both win.
Is Micron overvalued at a $1.4 trillion market cap?
Not on run-rate earnings (~10x), but the market is paying that low multiple precisely because it expects earnings to fall. To justify ~$1,238 at a normal 15–18x semiconductor multiple, you would need ~$69–83 of durable 'normalized' EPS. So it is fairly-to-fully valued — priced for continued excellence with a cyclicality discount, not cheap. The bet is that the SCAs make the earnings more durable than the market assumes.